Through the use of stylish, informative graphics, this title explores the science behind continental drift and discusses how this process has shaped our planet.
This title discusses the diversity of life on our planet and uses infographics to explore how plants and animals have made their homes in every habitat that the world has to offer.
Using factual infographics, this title explores how humanity’s impact on the environment is affecting species all around the world and pushing some of them to the brink of extinction.
Journey into space and learn about the different parts of the solar system with this explorative title. Focused on image-led, fun, and factual information, readers will be captivated from start to fin
Find out more about the different weather types and discover why we have seasons with this fascinating title that uses modern graphics to bring the subject area to life.
Focusing on the five main animal groups and the process of reproduction, birth, and growth, this book combines accessible, factual text with modern graphics.
"Infographics are simple and creative graphic representations of different numerical facts. This title features a variety of engaging infographics that teach readers all about animals. Look through t
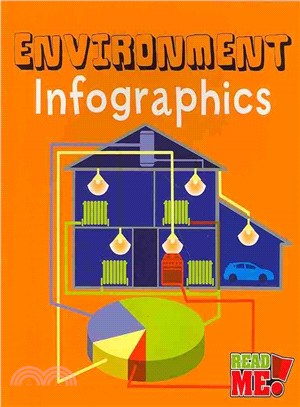
"Infographics are simple and creative graphic representations of different numerical facts. This title features a variety of engaging infographics that teach readers all about the environment. Look th
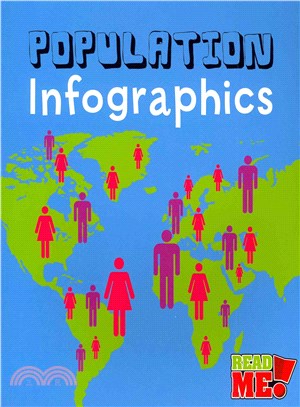
"Infographics are simple and creative graphic representations of different numerical facts. This title features a variety of engaging infographics that teach readers all about world population. Look t
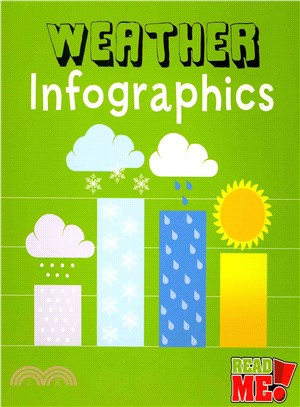
"Infographics are simple and creative graphic representations of different numerical facts. This title features a variety of engaging infographics that teach readers all about the weather. Look throu
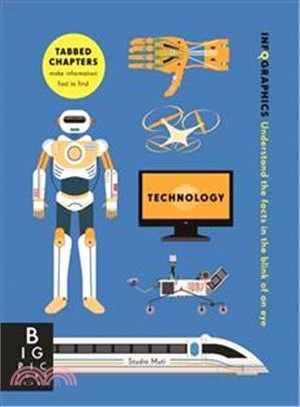
The fourth book in the visually stunning Infographics series, which showcases information and data in stunning graphic visualisations. Complex facts about technology are explained through stylish info
Infographics For Dummies will focus on the how-to of data, design, and distribution in order to create visually-stunning, shareable infographics. Each element is as important as the others to have a s
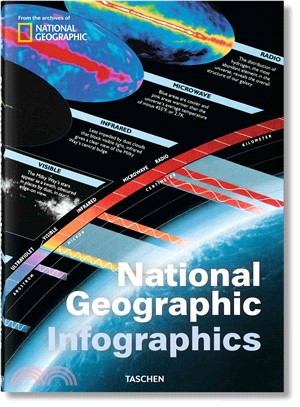
A history of knowledgeThe best infographics from the National Geographic archivesBack in the days when the information age was a distant dream and the world a more mysterious place, National Geographi
Visual fluency for the digital native In a world of fast-moving news, unwavering digital exposure, and informational memes, kids (and adults) are bombarded with infographics. Presenting informati
Complex facts about the human body are reinterpreted as stylish infographics, which astonish, amuse and inform by turn. Researched by the Guardian's Datablog expert and designed by the father of infog
Welcome to the world of infographics! This exciting form of data visualisation uses icons, pictograms and graphics to present information in a whole new way. Read about how gravity keeps the planets o
A revelatory history of World War II, told entirely through visually stunning state-of-the-art infographics.World War II: Infographics tells the story of the great conflict through graphic design. The
Anatomy of ideasThe life’s work of an infographics pioneerFritz Kahn (1888–1968) was a German doctor, educator, popular science writer, and information graphics pioneer. Chased out of Germ
This complete how-to guidebook provides you with the tools and inspiration you need to use infographics and data visualization techniques in your library to knock your audience’s socks off as you tell
This complete how-to guidebook provides you with the tools and inspiration you need to use infographics and data visualization techniques in your library to knock your audience’s socks off as you tell
Third in a series of highly illustrated books on infographics, printed in bright pantones. Amazing and amusing facts researched by Datablog founder Simon Rogers, founder of the world’s most popular da
Uses infographics to explore United States geography, including the climate in different regions, the country's highest and lowest point, and which cities are the most densely populated.
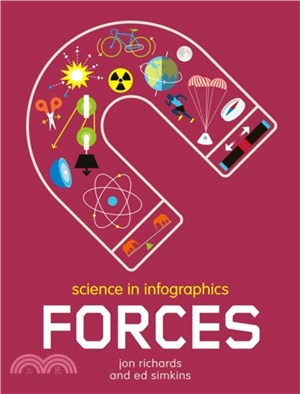
This unique series harnesses the immediacy and visual appeal of infographics to present scientific facts, information and processes in a whole new way.
Infographics can pack a lot of information into a small amount of space with clever use of text and images. Readers will find out how to unpack, draw evidence from, evaluate, and integrate content pre